|
Population (Mid-2012)
1,850,000 Density (people per sq. km) 3 Net Migration Rate (# per 1000 people) 2 Birth Rate (# per 1000 people) 26 Death Rate (# per 1000 people) 13 Rate of Natural Increase 1.2% Population Growth Rate 1.3 Infant Mortality Rate (# of deaths per 1000 live births) 36.0 Total Fertility Rate (average # of children per woman) 2.8 Population Age <15 % 34% Population Ages 65+ % 4% Dependency Rate 38% Life Expectancy at Birth (average of genders) 53 Life Expectancy at Birth (Females) 52 Life Expectancy at Birth (Males) 54 Primary School Completion Rate (Females) 97% Primary School Completion Rate (Males) 93% Secondary School Enrollment (Net Females) 64% Secondary School Enrollment (Net Males) 56% GNI PPP per capita in US$ $12,840 Population Living Below US$2 per day Data unavailable Economically Active Females 15+ 72% Economically Active Males 15+ 81% Mobile Phone Subscribers (# per 100) 77 Motor Vehicles (# per 1000) 106 Undernourished Population 32.0% Underweight Children Under Age 5 11.0% HIV/AIDS Among People Ages 15-49 24.8% |
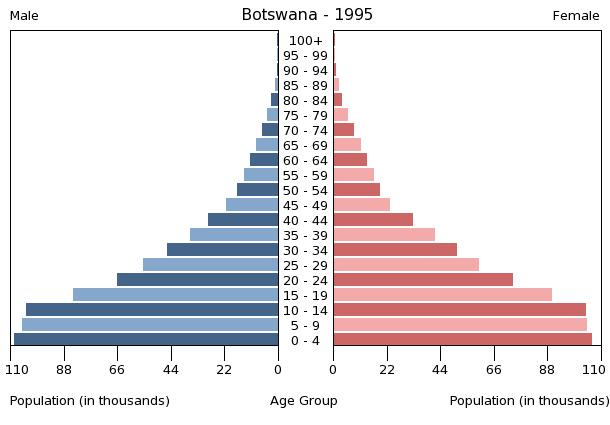
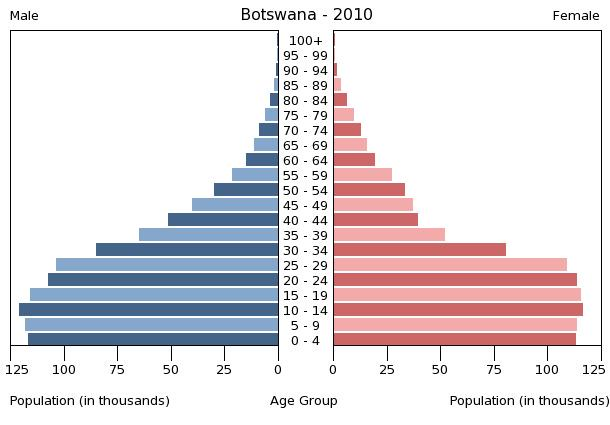
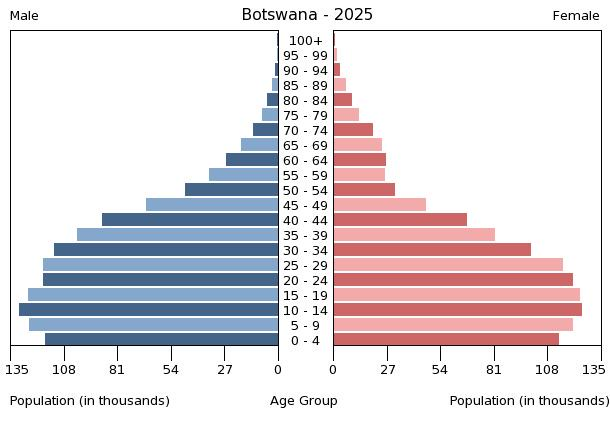
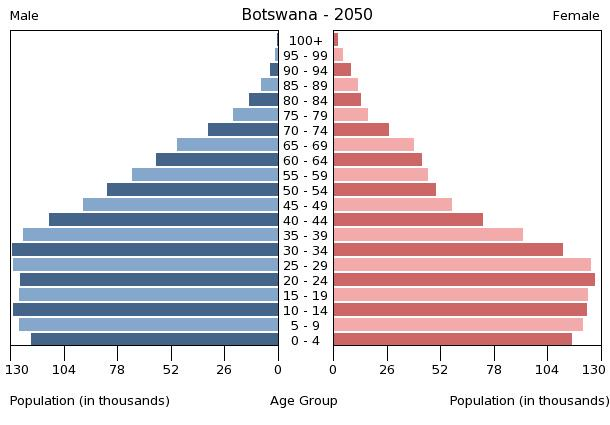
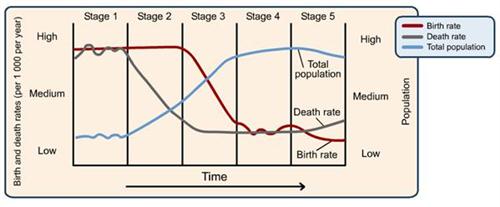
Botswana has a very high birth rate and a declining death rate. The population is growing very rapidly due to this large natural increase. Although Botswana has a high birth rate, they also have a very hig infant mortality rate. Many children die at a very young age. The death rate decreases and the life expectancy rises due to the death of gradually fewer children as time and technlogy evolves. Considering all of this information, one could conclude that Botswana is in stage 3 of the Demographic Transition Model shown below.
|
