|
Population (Mid-2012)
60,949,900 Density (people per sq. km) 202 Net Migration Rate (# per 1000 people) 6 Birth Rate (# per 1000 people) 9 Death Rate (# per 1000 people) 10 Rate of Natural Increase -0.1% Population Growth Rate 0.6 Infant Mortality Rate (# of deaths per 1000 live births) 3.7 Total Fertility Rate (average # of children per woman) 1.4 Population Age <15 % 14% Population Ages 65+ % 21% Dependency Rate 35% Life Expectancy at Birth (average of genders) 81 Life Expectancy at Birth (Females) 84 Life Expectancy at Birth (Males) 79 Primary School Completion Rate (Females) 104% Primary School Completion Rate (Males) 104% Secondary School Enrollment (Net Females) 95% Secondary School Enrollment (Net Males) 94% GNI PPP per capita in US$ $31,870 Population Living Below US$2 per day Data unavailable Economically Active Females 15+ 38% Economically Active Males 15+ 61% Mobile Phone Subscribers (# per 100) 152 Motor Vehicles (# per 1000) 670 Undernourished Population <2.5% Underweight Children Under Age 5 Data unavailable HIV/AIDS Among People Ages 15-49 0.3% |
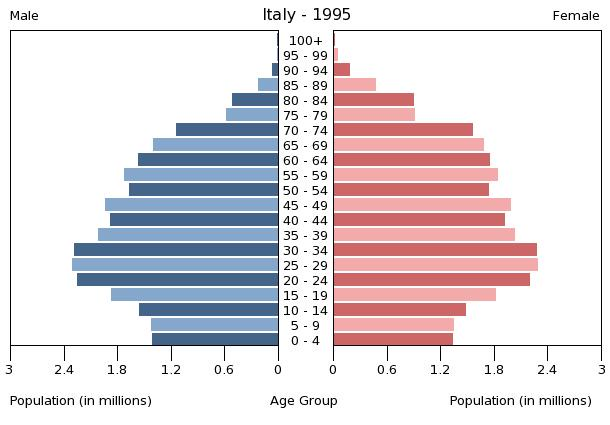
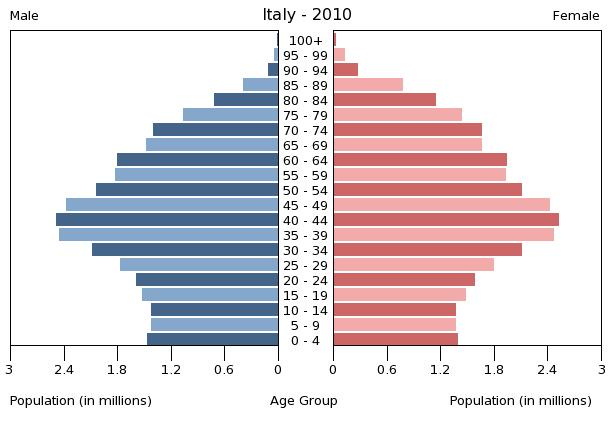
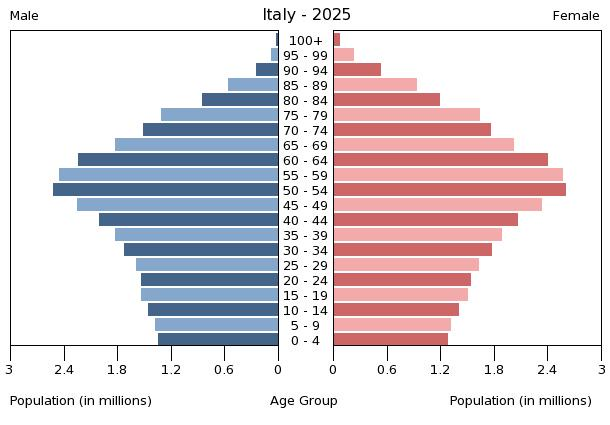
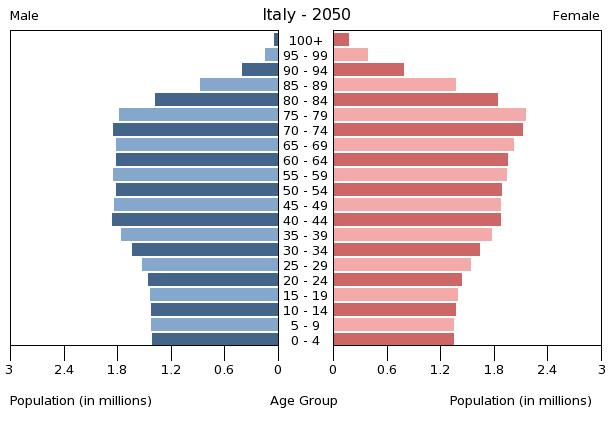
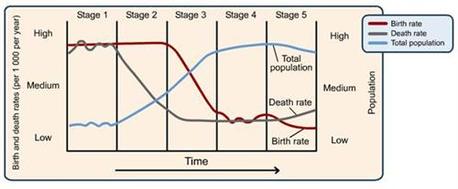
Italy would be identified as being in stage 5 on the Demographic Transition Model, shown below. The birth rate is lower than the death rate. The rate of natural increase is negative and the population growth rate is small as well. The low death rate could be the result of better health care, because the number of malnourished/underweight poeple is mimiscule compared to the rest of the world. The HIV/AIDS percentage is also decreasing. A possible explaination behind the low birth rate could be the education of women increasing, keeping them from having children until later in life.
|
